Population in Spain
The population shows the effects on the water resources through demands of water supply.
POPULATION IN SPAIN
The evolution of the population in Spain represents a subject of maximum interest at the time of evaluating the needs of hydric resources. The demographic studies of our country, the occupational and territorial dynamics and the trends in the future, are fundamental data for the management of our hydric resources.
The following figure presents data about the evolution of the population from 1996 to 2008, providedby the National Institute of Statistics.
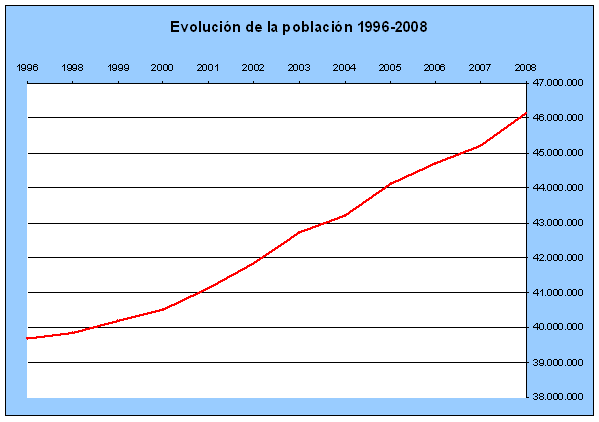
Figure 1. Evolution of the population from 1996 to 2008
The following graph shows the evolution of the population by region. The Autonomous Communities with a greater increase of population are Catalonia, Madrid, Andalusia and Valencia, mainly due to the receipt of international and national immigrants. Others, such as Extremadura, Cantabria and Asturias have remained stable or with slight ascents.
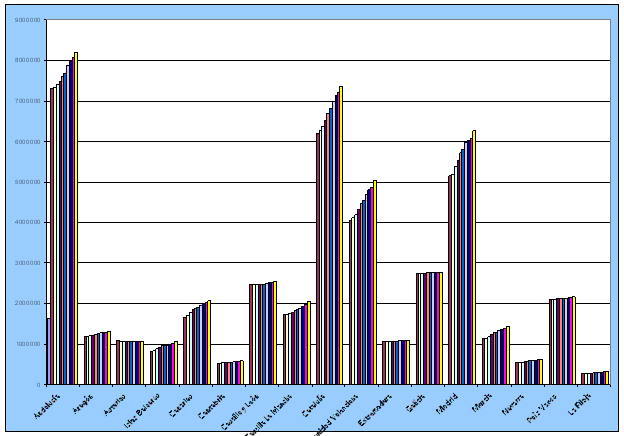
Figure 2. Evolution of the Population by Autonomous Community
The population density shows the number of inhabitants per unit area and is a fundamental factor to consider in the water management, because it determines the water demand in a territory and the main uses, the associate contamination and the number of hydraulic infrastructures necessary to complete the water cycle in a sustainable form.
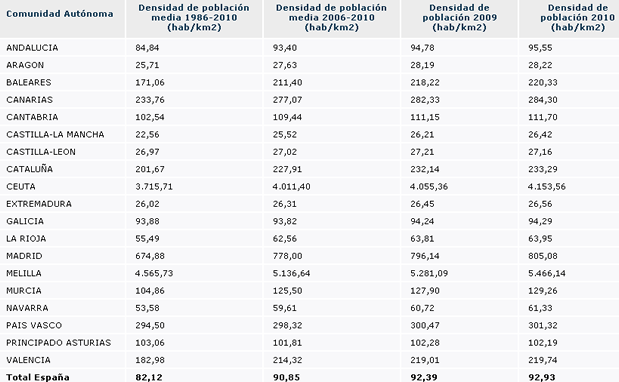
Table 1: Population density by Autonomous Community (1986-2010). Source: Sistema Integrado de Información del Agua. SIA
The economic development thatSpain has suffered in the last decades has supposed an increase in water demand. This is because the water demand is directly proportional to the population, living standards and economic development.
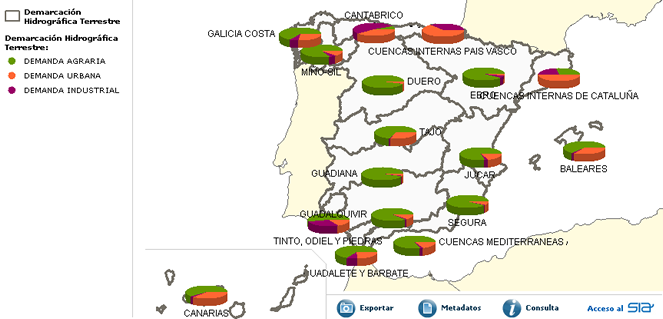
Figure 1: Map of water demand by Hydrographic Demarcation.Source: Sistema Integrado de Información del Agua. SIA
Of global way in Spain 80% of the water demand are destined for agricultural uses, 15% to urban uses and a 5% to industrial uses.
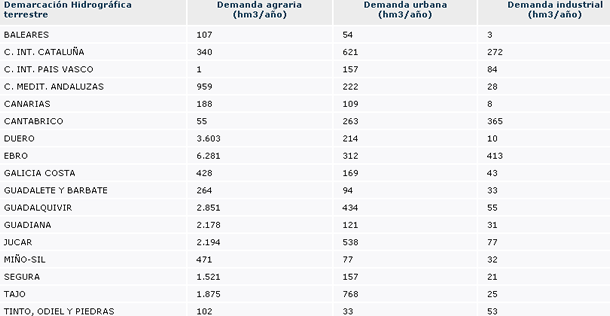
Table 2: Water demands by Hydrographic Demarcation. Source: Sistema Integrado de Información del Agua. SIA
The following graph shows the water consumption in the households in 2006.
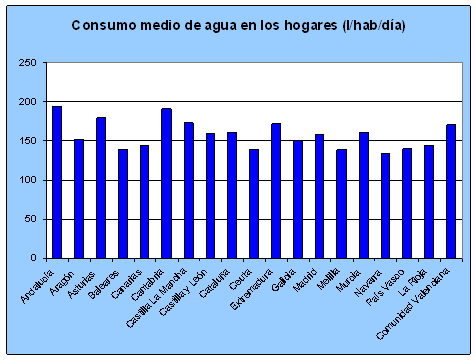
Figure 3. Water consumption in households. Year 2006
POPULATION IN EUROPE
The population in Europe is affected in the last years by a low rate of natality, which entails an aging process that will have social and economic consequences in the future. In the follow table, can you see a natural growth of the global population, that it must to the migratory flows, with a net balance of 1.662.500 people.
The negative tendency emphasizes in countries like Bulgaria, Germany, Estonia, Italy, Lithuania, Latvia, Hungary and Rumania. The majority of these countries, of the east, must add to this data the fact that their populations migrate towards other countries.
In the case of Spain the situation is very similar to the global of the EU. A natural positive growth is appraised but, nevertheless, the increase of the population must to the emigration that contributes a total of 464,300 people.
The following graphs shows more in depth the diminution of the young population and the increase of people between 25 and 49 years. This, combined with the increase of the life expectancy in Europe, demonstrates the aging of the population in the European Union.
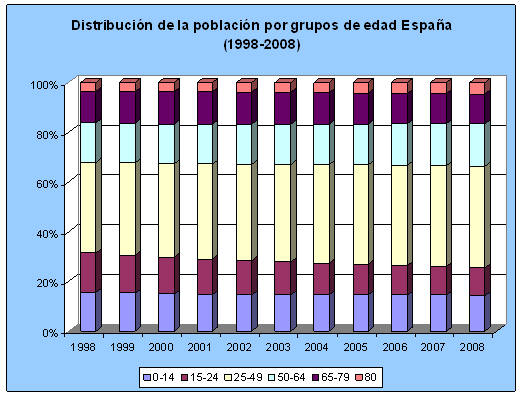
Figure 4. Distribution of the population in Spain. Source: INE. Own elaboration
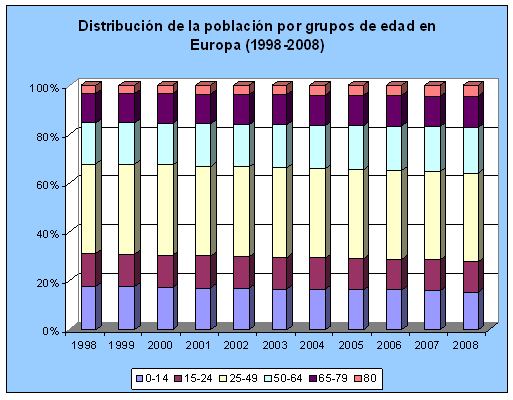
Figure 5. Distribution of the population in Europe. Source: Eurostat. Own elaboration .


